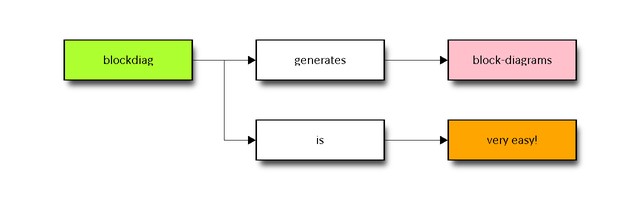
blockdiag 및 해당 제품군은 단순히 텍스트 파일에서 다이어그램 이미지를 생성합니다.특징 : 많은 유형의 다이어그램 지원 블록 다이어그램 (w / blockdiag) 시퀀스 다이어그램 (w / seqdiag) 활동 다이어그램 (w / actdiag) 논리적 네트워크 다이어그램 (w / nwdiag) 간단한 텍스트 형식 (DOT와 유사)에서 아름다운 다이어그램 이미지를 생성합니다.형식) 레이아웃 다이어그램 요소 자동 많은 문서에 포함됩니다.스핑크스, Trac, Redmine 및 일부 위키
웹 사이트:
http://blockdiag.com카테고리
상용 라이센스가있는 모든 플랫폼에서 blockdiag를 대체
10
4
KeyLines Graph Visualization Toolkit
KeyLines는 고성능 그래프 시각화 응용 프로그램을 신속하게 구축하기위한 JavaScript 툴킷입니다.
3