'엑셀'기능이있는 앱
0
0
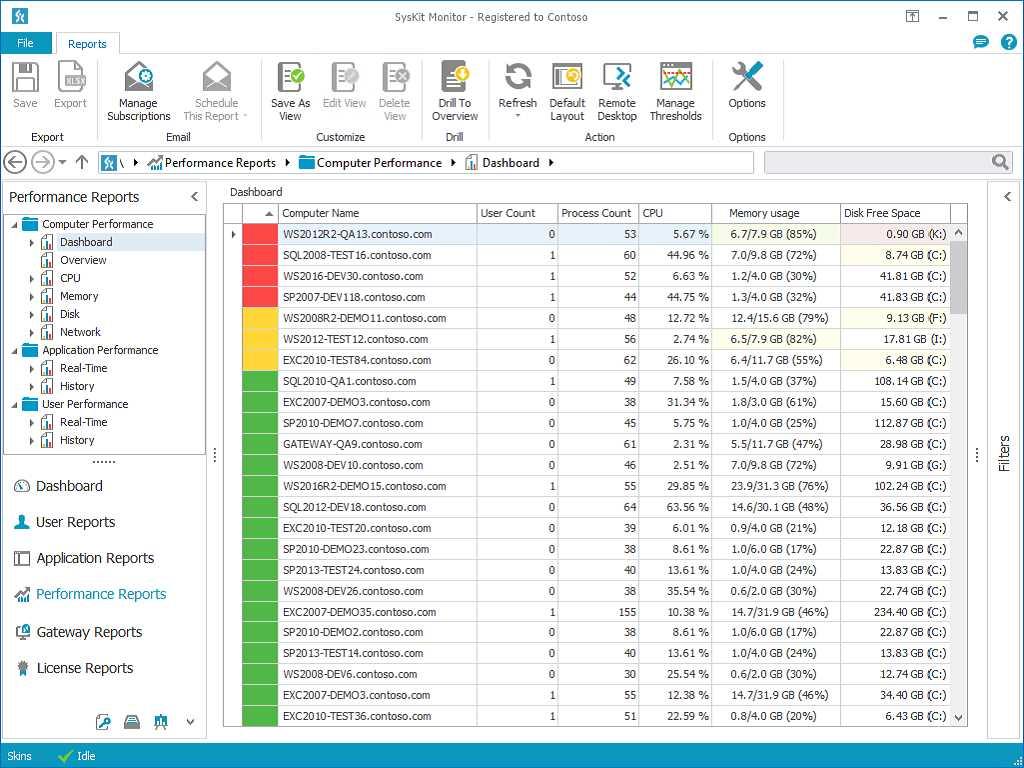
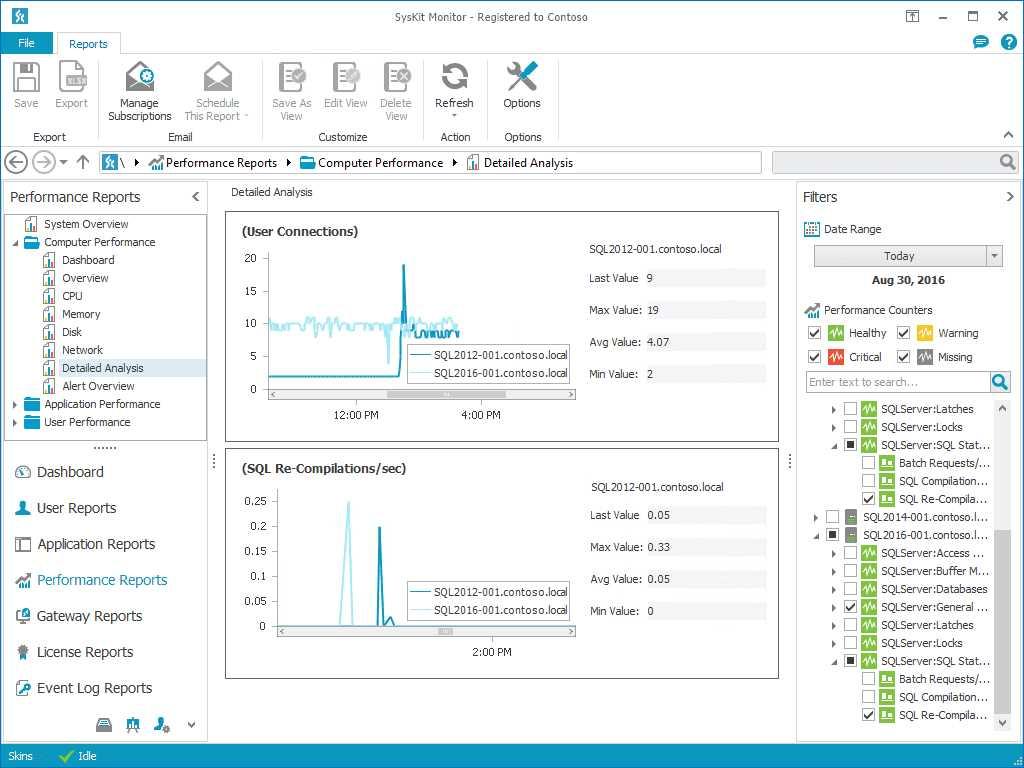
SysKit Monitor
사용자, 응용 프로그램, 성능 카운터, 서비스 및 IT 자산을 추적 할 수있는 서버 관리 및 모니터링 솔루션입니다.
0
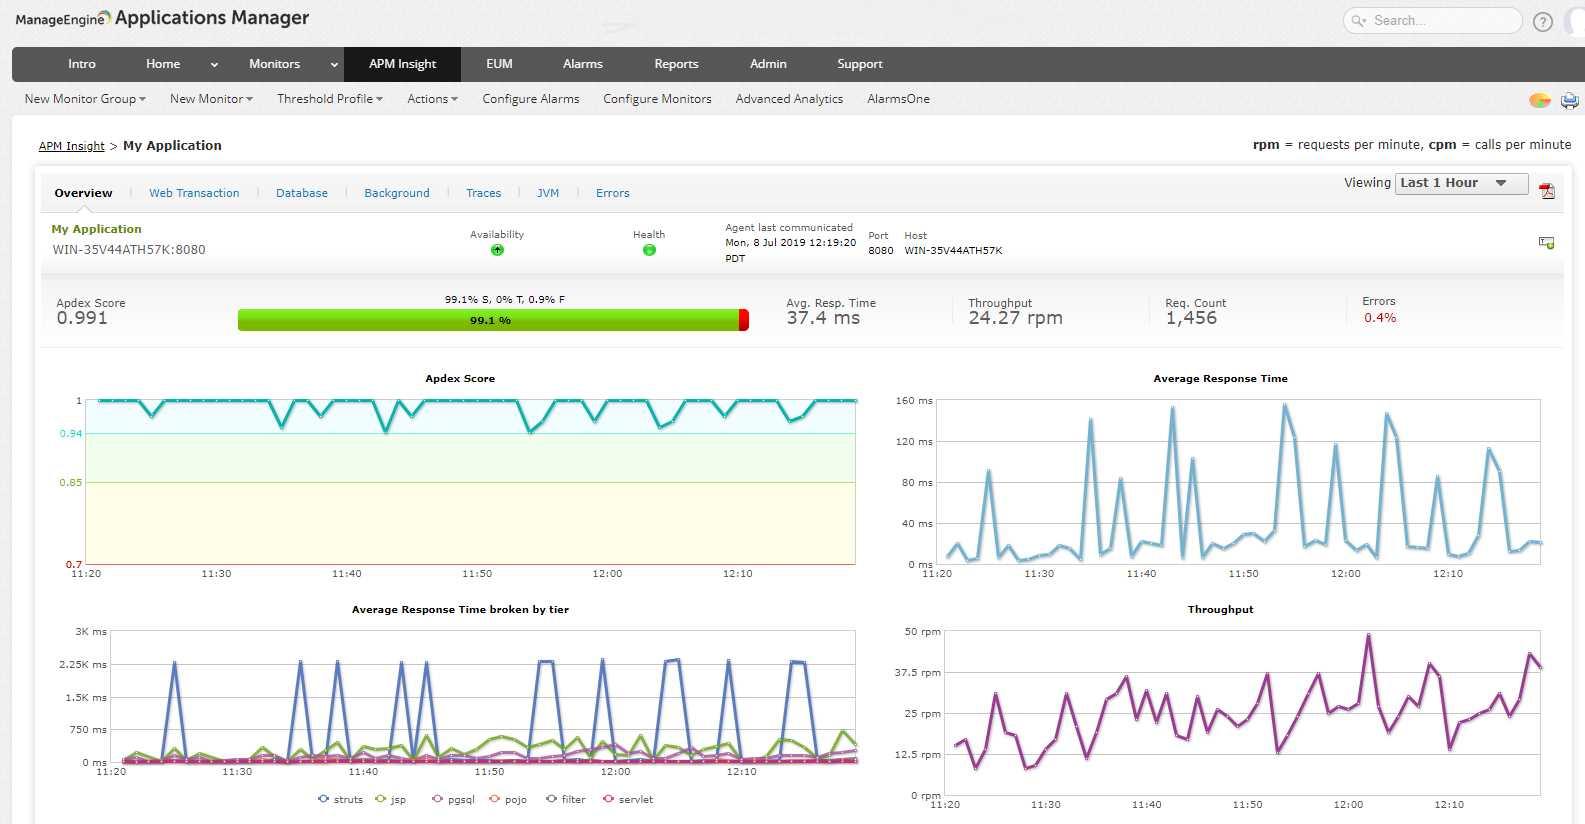
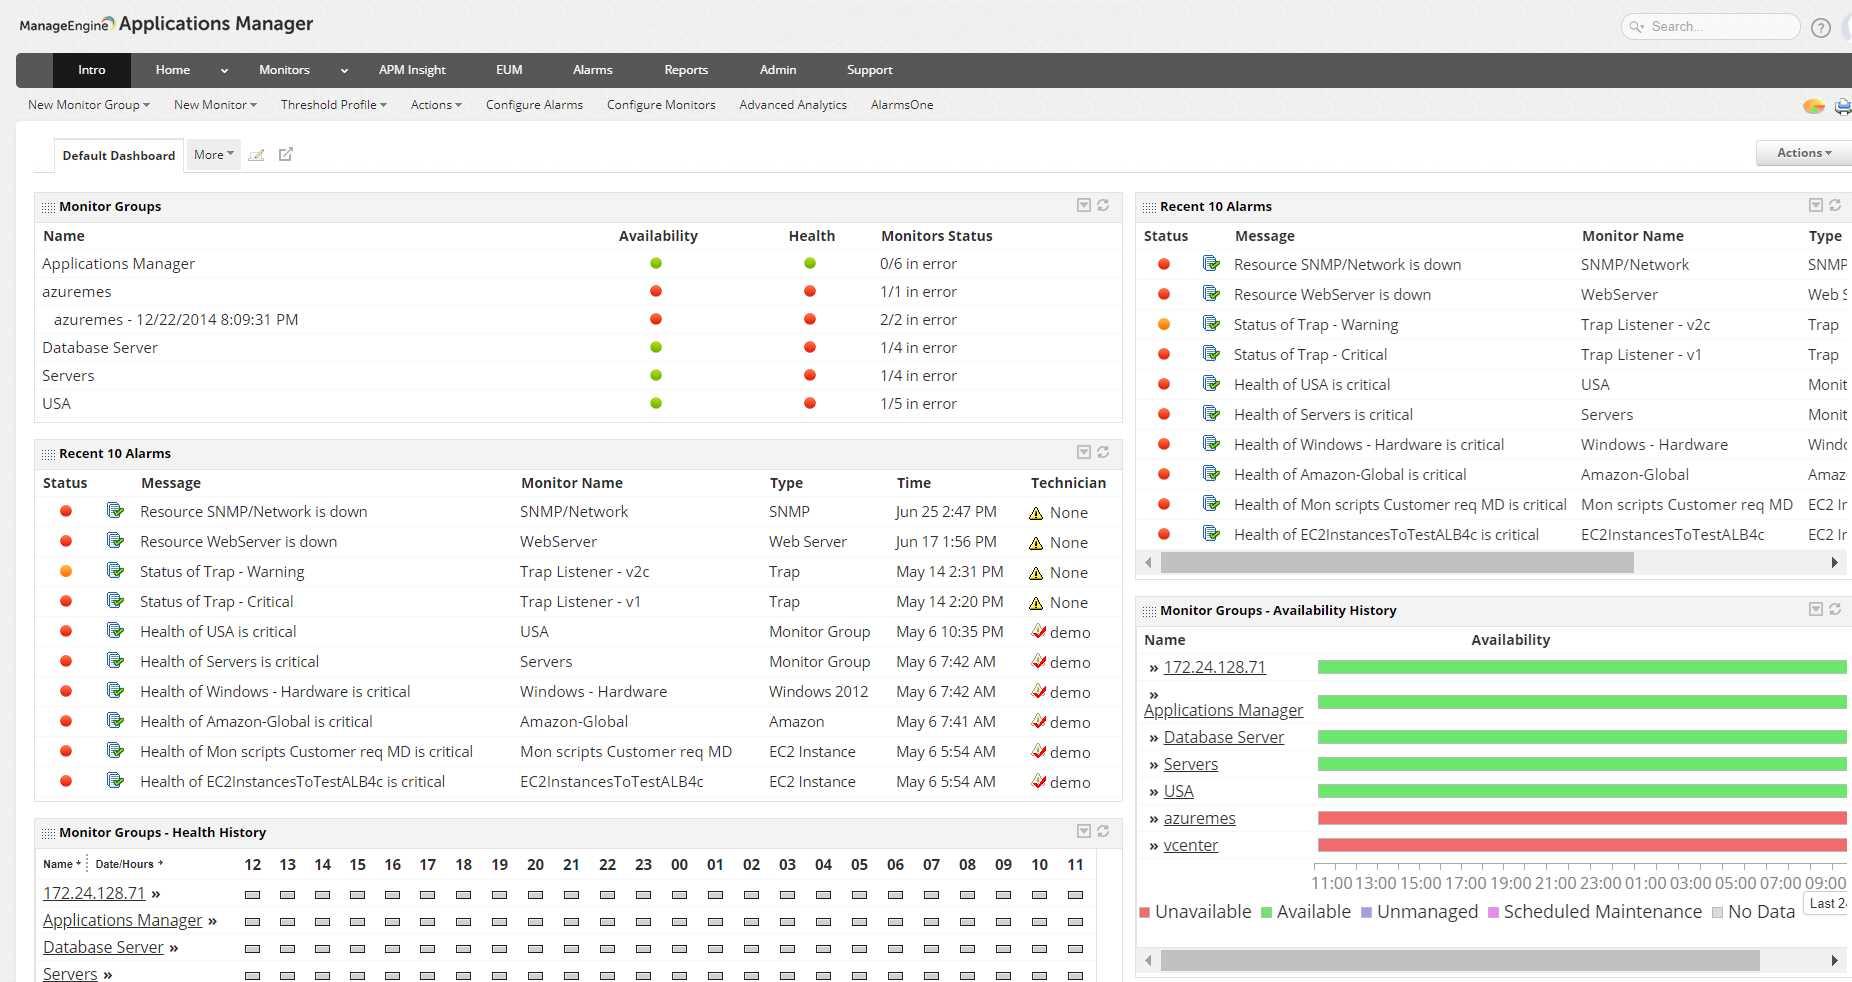
ManageEngine Applications Manager
ManageEngine Applications Manager는 물리적, 가상 및 클라우드 환경에 걸쳐 100 개 이상의 비즈니스 애플리케이션 및 인프라 요소에 대한 성능 모니터링을 제공합니다.성능 문제를 신속하게 감지, 격리 및 해결하는 데 도움이됩니다.
0
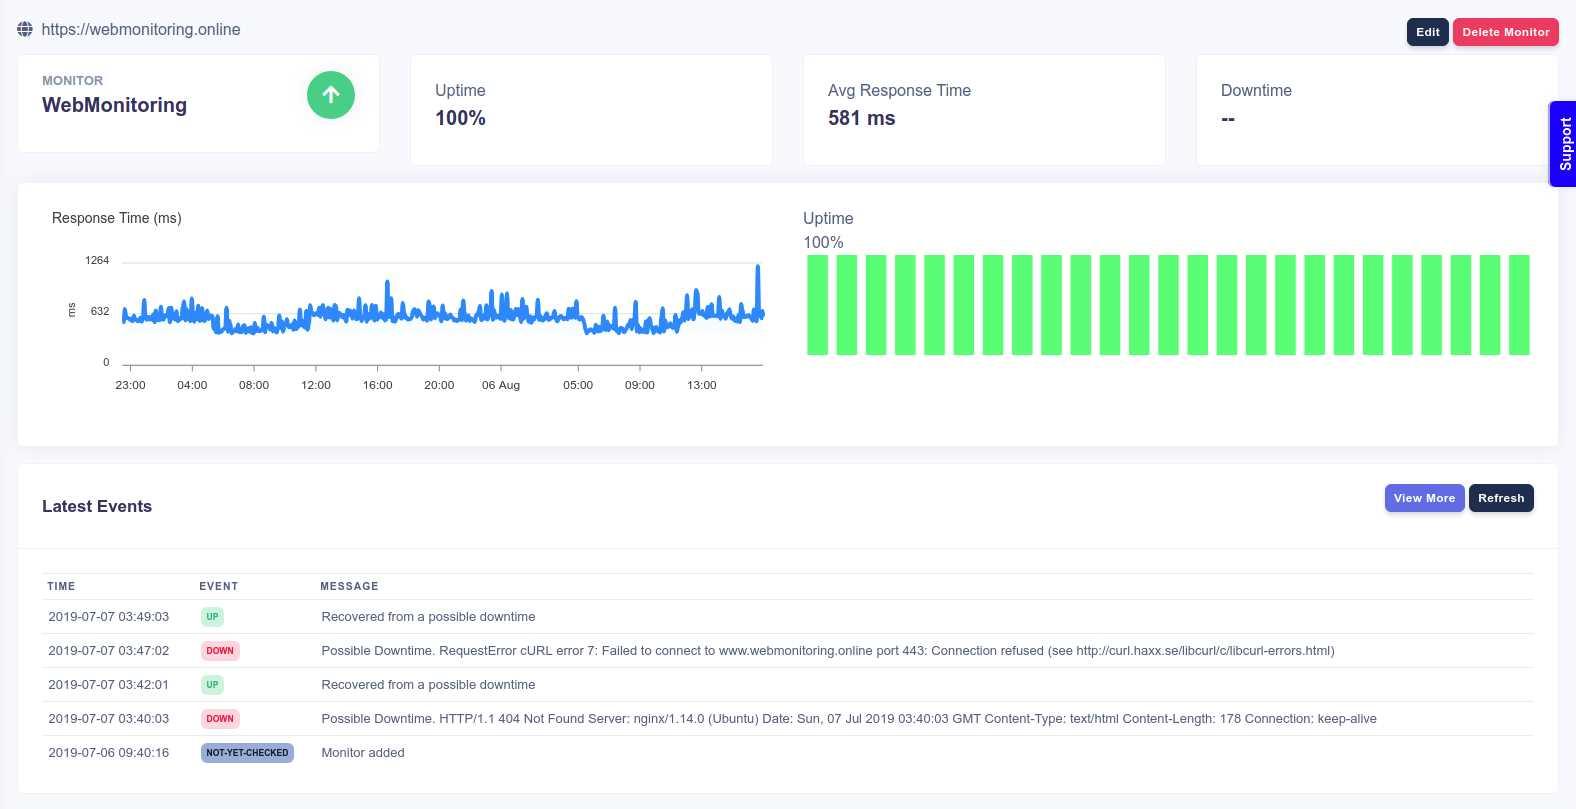
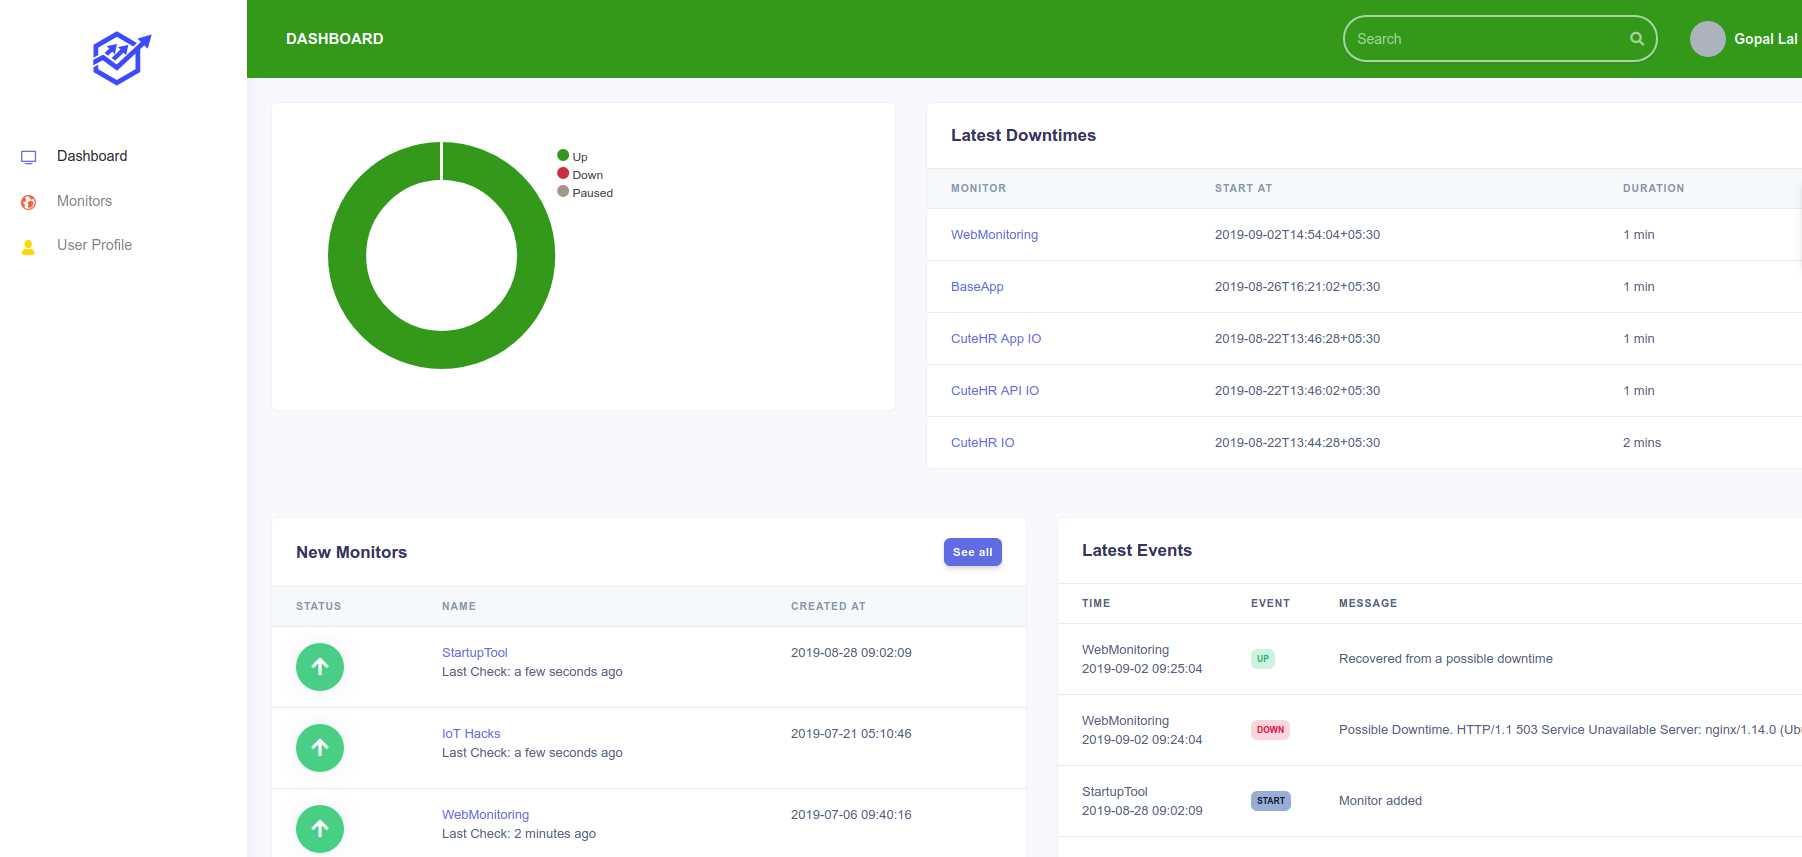
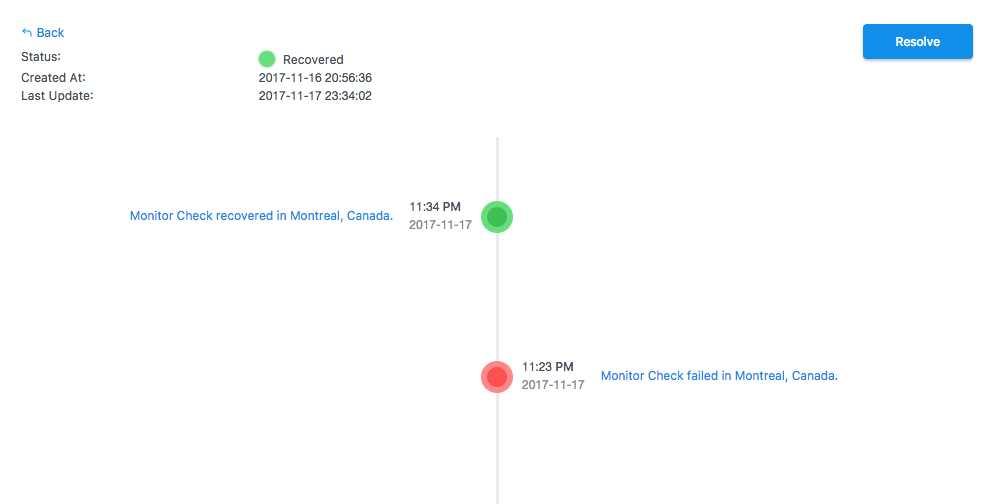
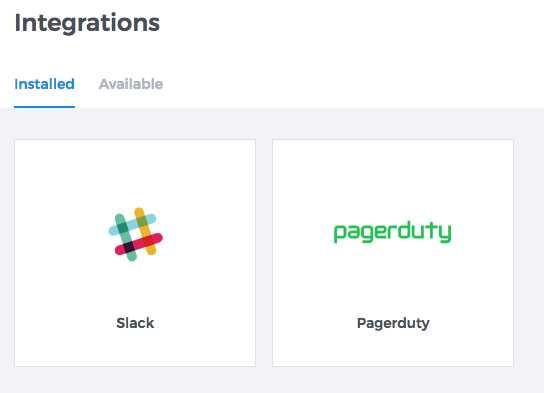
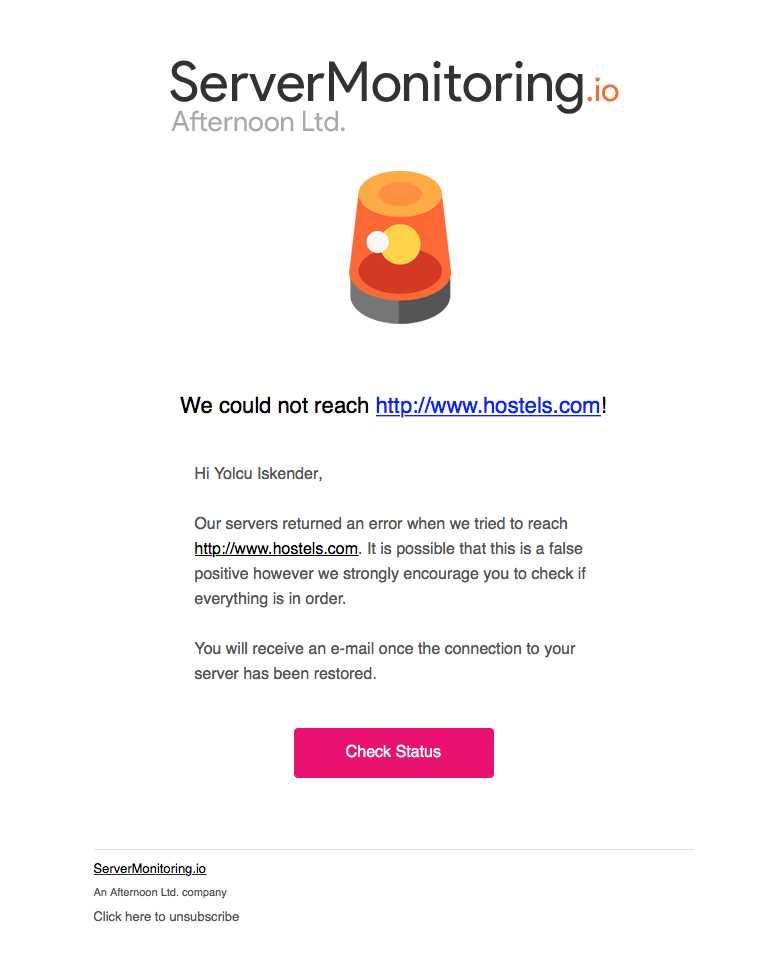
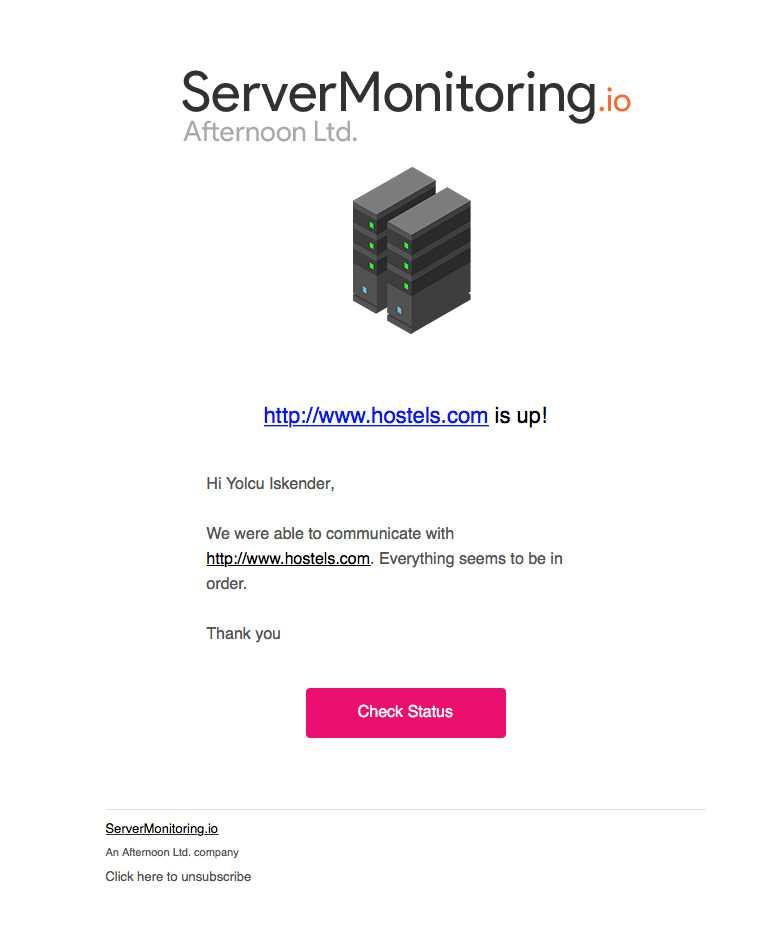
WebMonitoring Online
개발자를위한 웹 사이트 가동 시간 및 성능 모니터링 서비스.사용자에게 다운 타임 브라우징을 허용하지 마십시오.
0
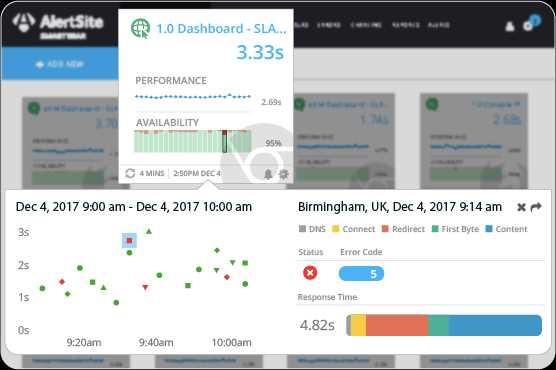
AlertSite
AlertSite는 웹, 앱 및 API를위한 종합 모니터링 도구입니다.코드가없고 사용하기 쉽고 예측 가능하며 포괄적이며 UI 및 API 계층 모두에서 사용자 여정을 모니터링 할 수 있습니다.
0
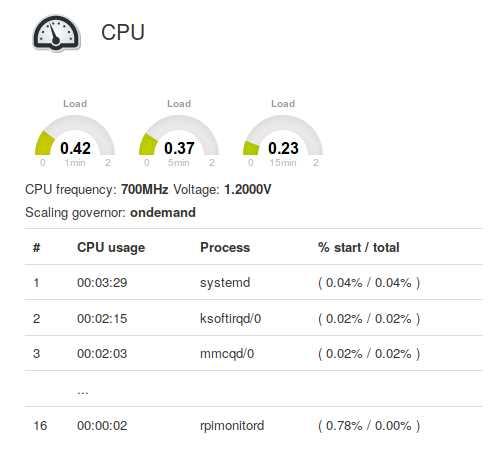
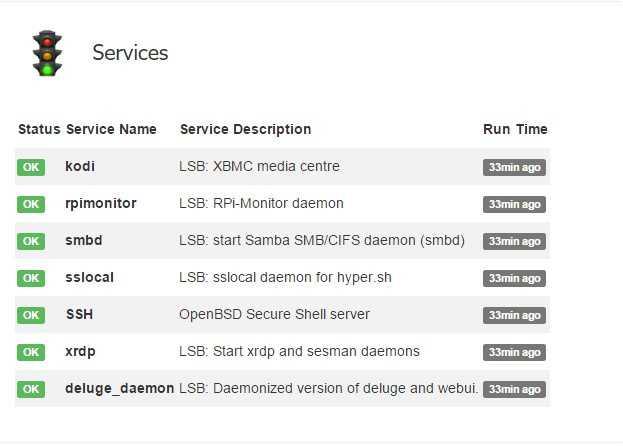
RPi-Monitor
RPi-Monitor는 GNU / Linux 시스템 및 연결된 주변 장치의 메트릭을 모니터링하도록 설계된 소프트웨어입니다.로컬 라운드 로빈 데이터베이스에 통계를 저장하고 현재 상태 및 통계를 표시 할 수있는 웹 서버를 포함합니다.
0
0
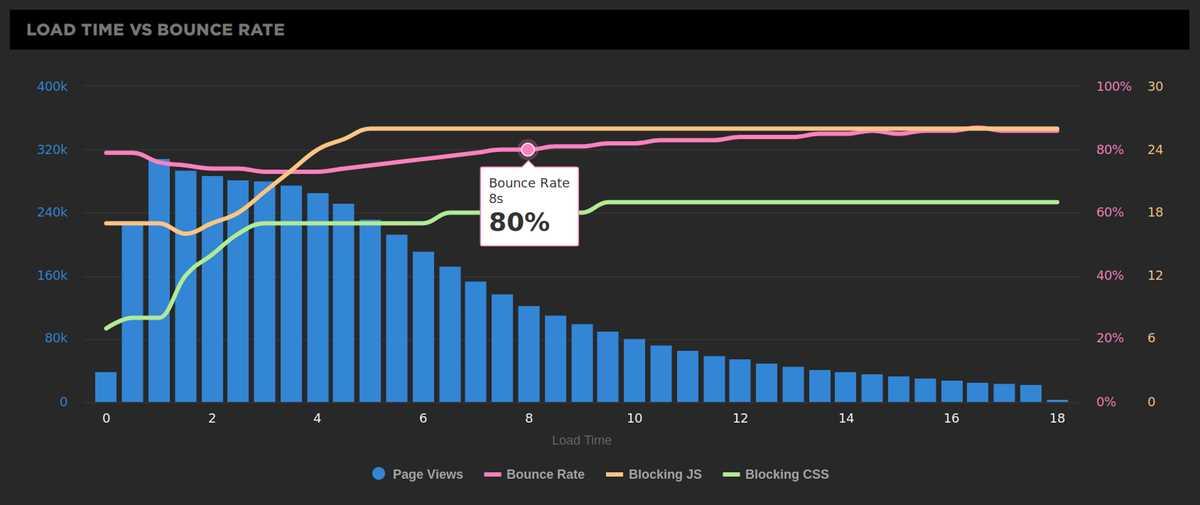
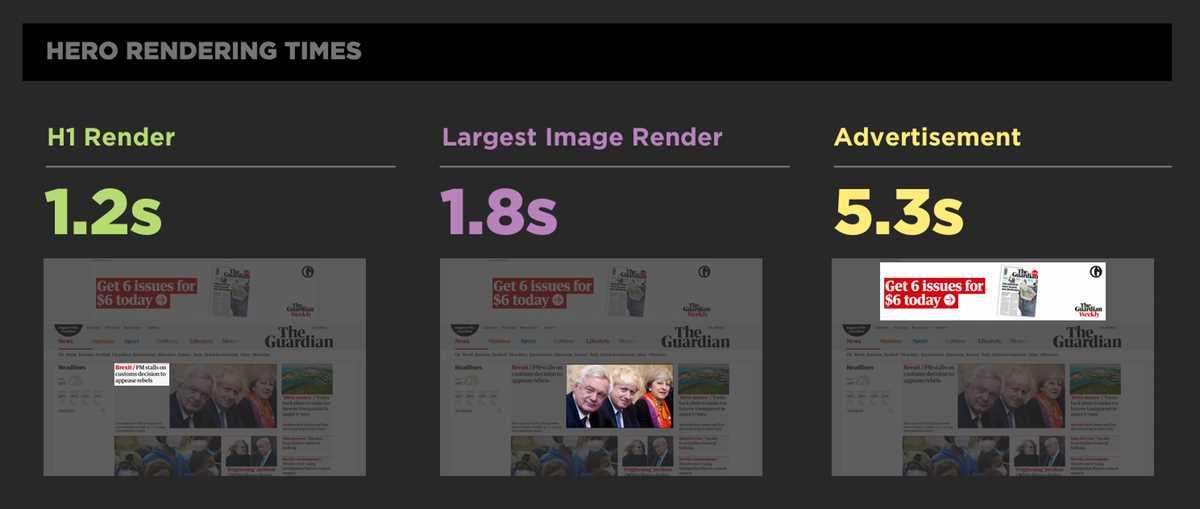
SpeedCurve
프론트 엔드 성능과 웹 사이트 구축을 모니터링하십시오.자신을 다른 사람들과 비교하고 경쟁에서이기십시오.
1
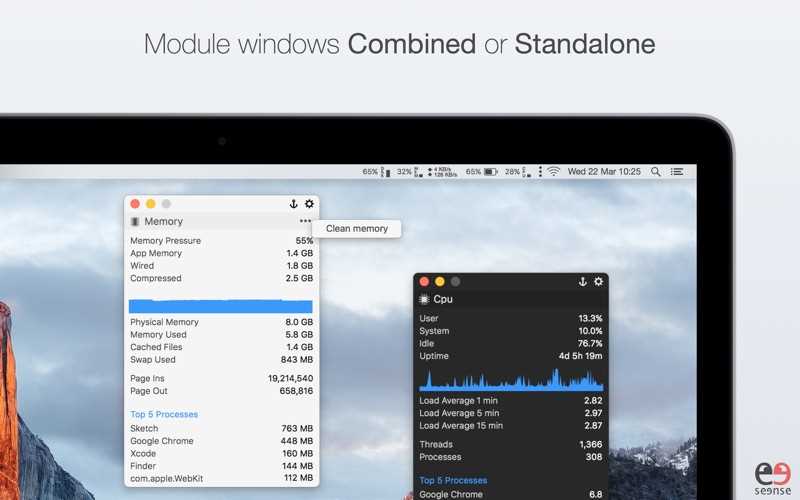
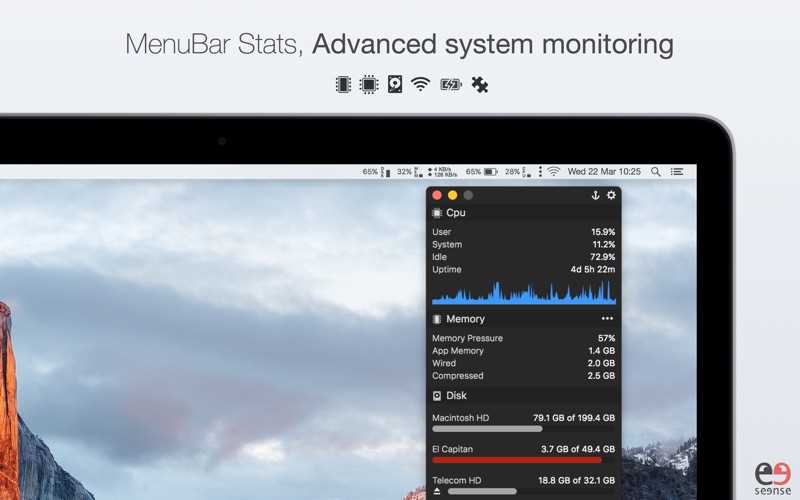
MenuBar Stats
MenuBar Stats 2가 새로워졌습니다.처음부터 완전히 다시 작성했습니다.MenuBar Stats 2는 모듈 (CPU, 디스크, 네트워크 등)로 구성됩니다.
1
1
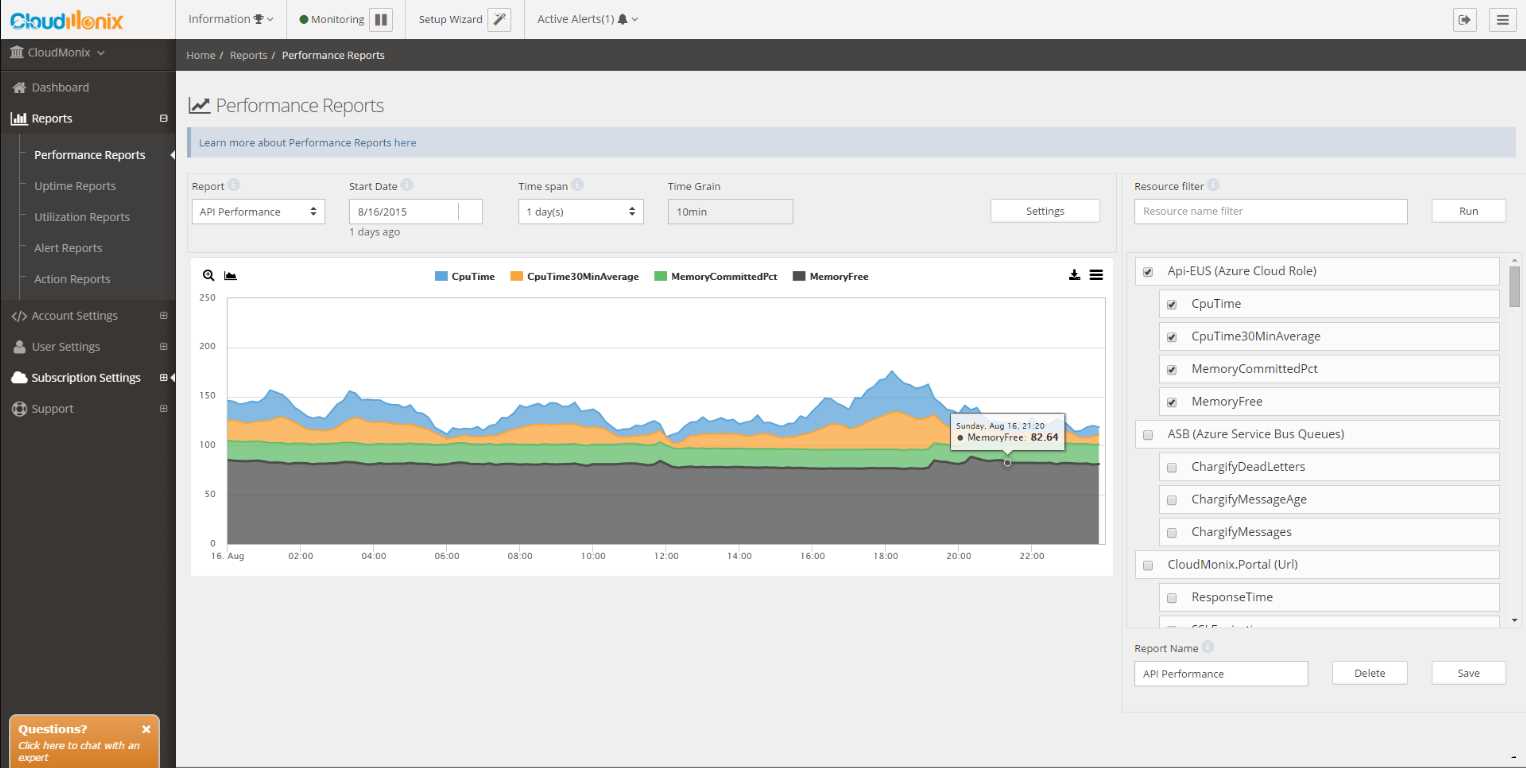
CloudMonix
MSP, CSP 및 DevOps를 염두에두고 구축 된 Azure 및 AWS 클라우드 모니터링 및 자동화 서비스.
0
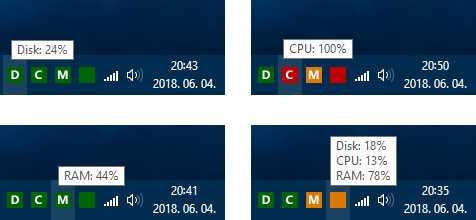
myResources
myResources는 그래프와 활성 아이콘을 사용하여 컴퓨터 기본 리소스 (디스크, CPU, 메모리, 네트워크)의로드 상태를 표시합니다.이 프로그램은 병합 된 그래픽 차트 (SumGraph)에 리소스를 표시 할 수도 있습니다.
0
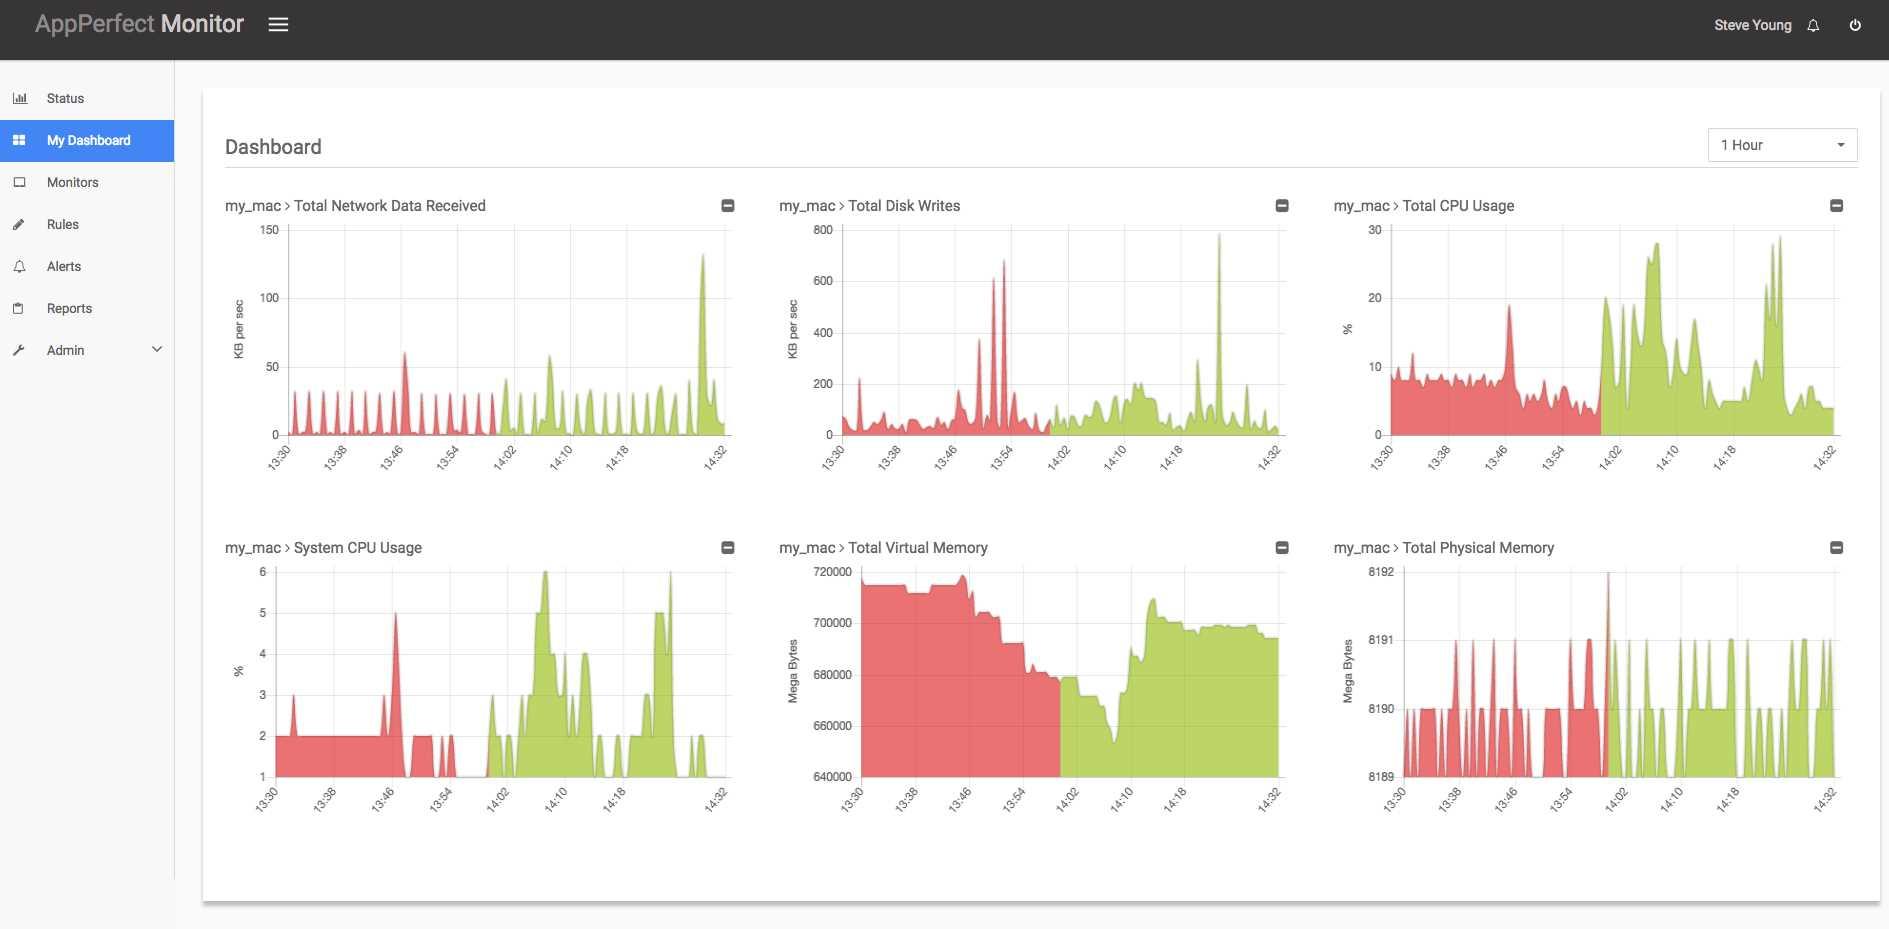
AppPerfect Agentless Monitor
에이전트없는 모니터는 JAVA / J2EE 애플리케이션 모니터링, 서버 모니터링, 데이터베이스 모니터링, 트랜잭션 모니터링, 네트워크와 같은 모니터링의 대부분의 측면을 다룹니다.
1
0
0
0
0
0
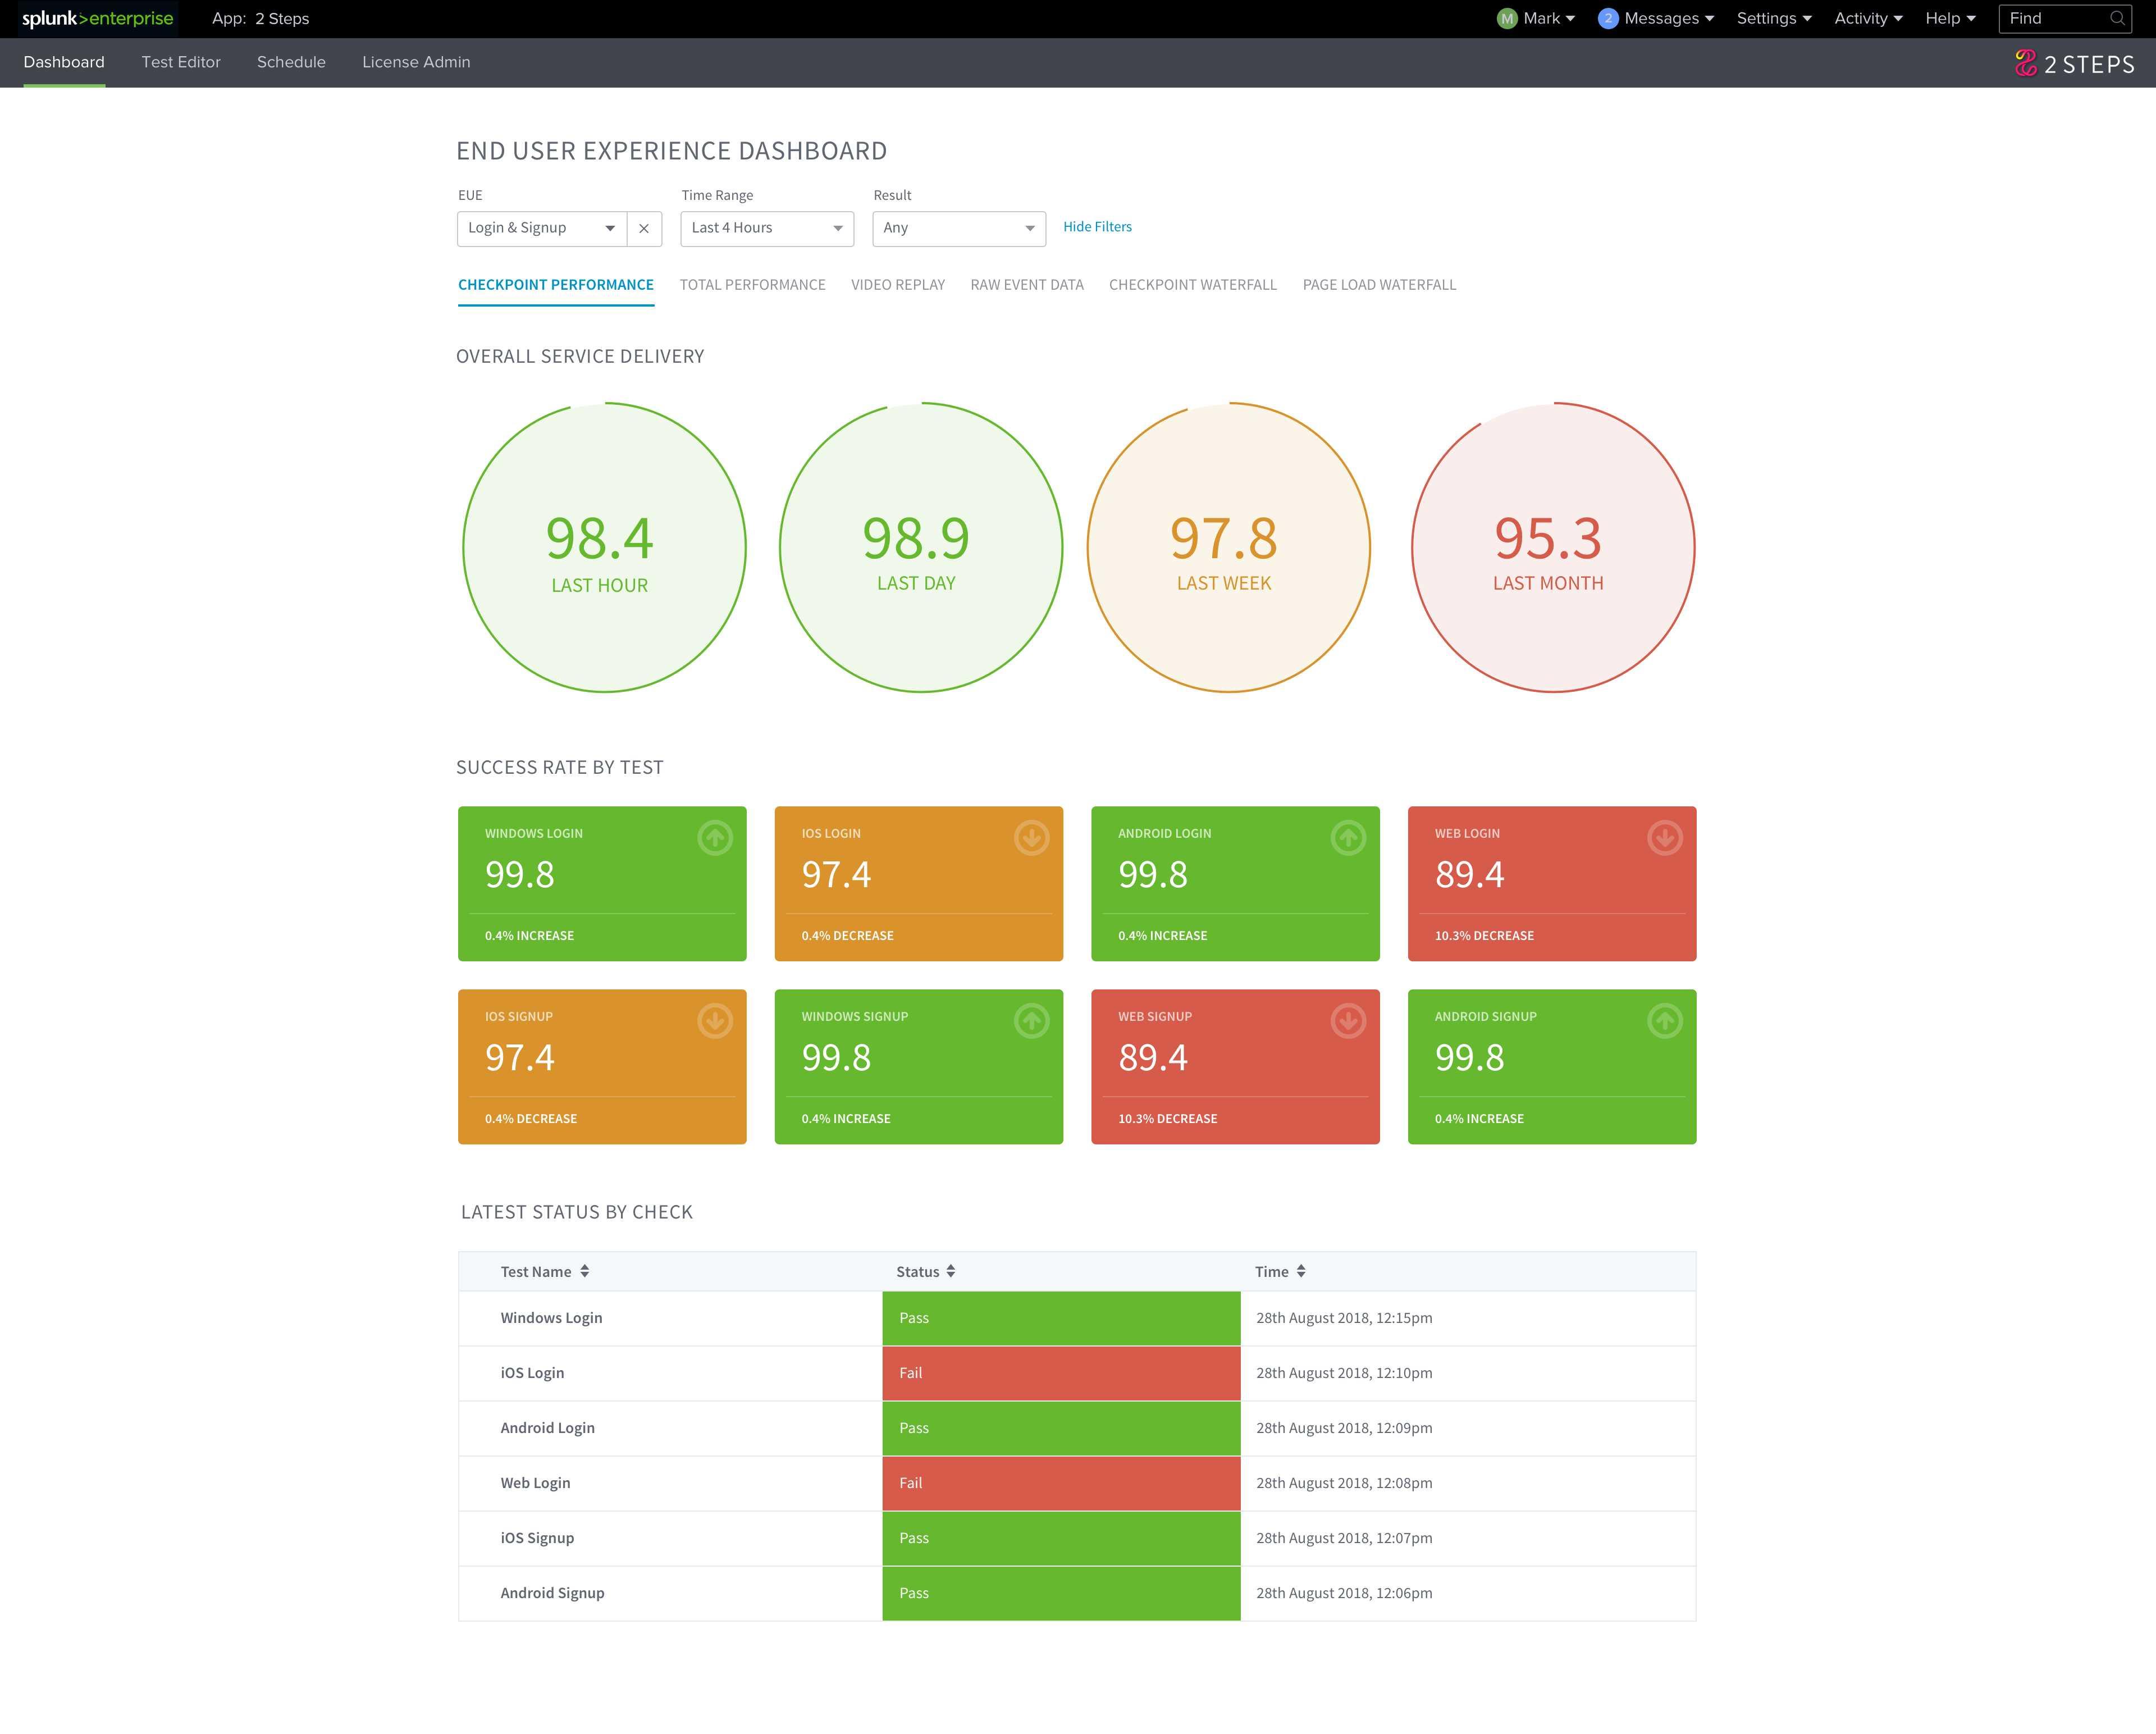
2 Steps
2 단계를 통해 IT 운영을 위해 Splunk를 사용하는 조직은 코딩이나 스크립트를 설정하지 않고도 모바일 앱, 웹 사이트, Windows 응용 프로그램 및 메인 프레임 소프트웨어 인터페이스를 모니터링 할 수 있습니다.