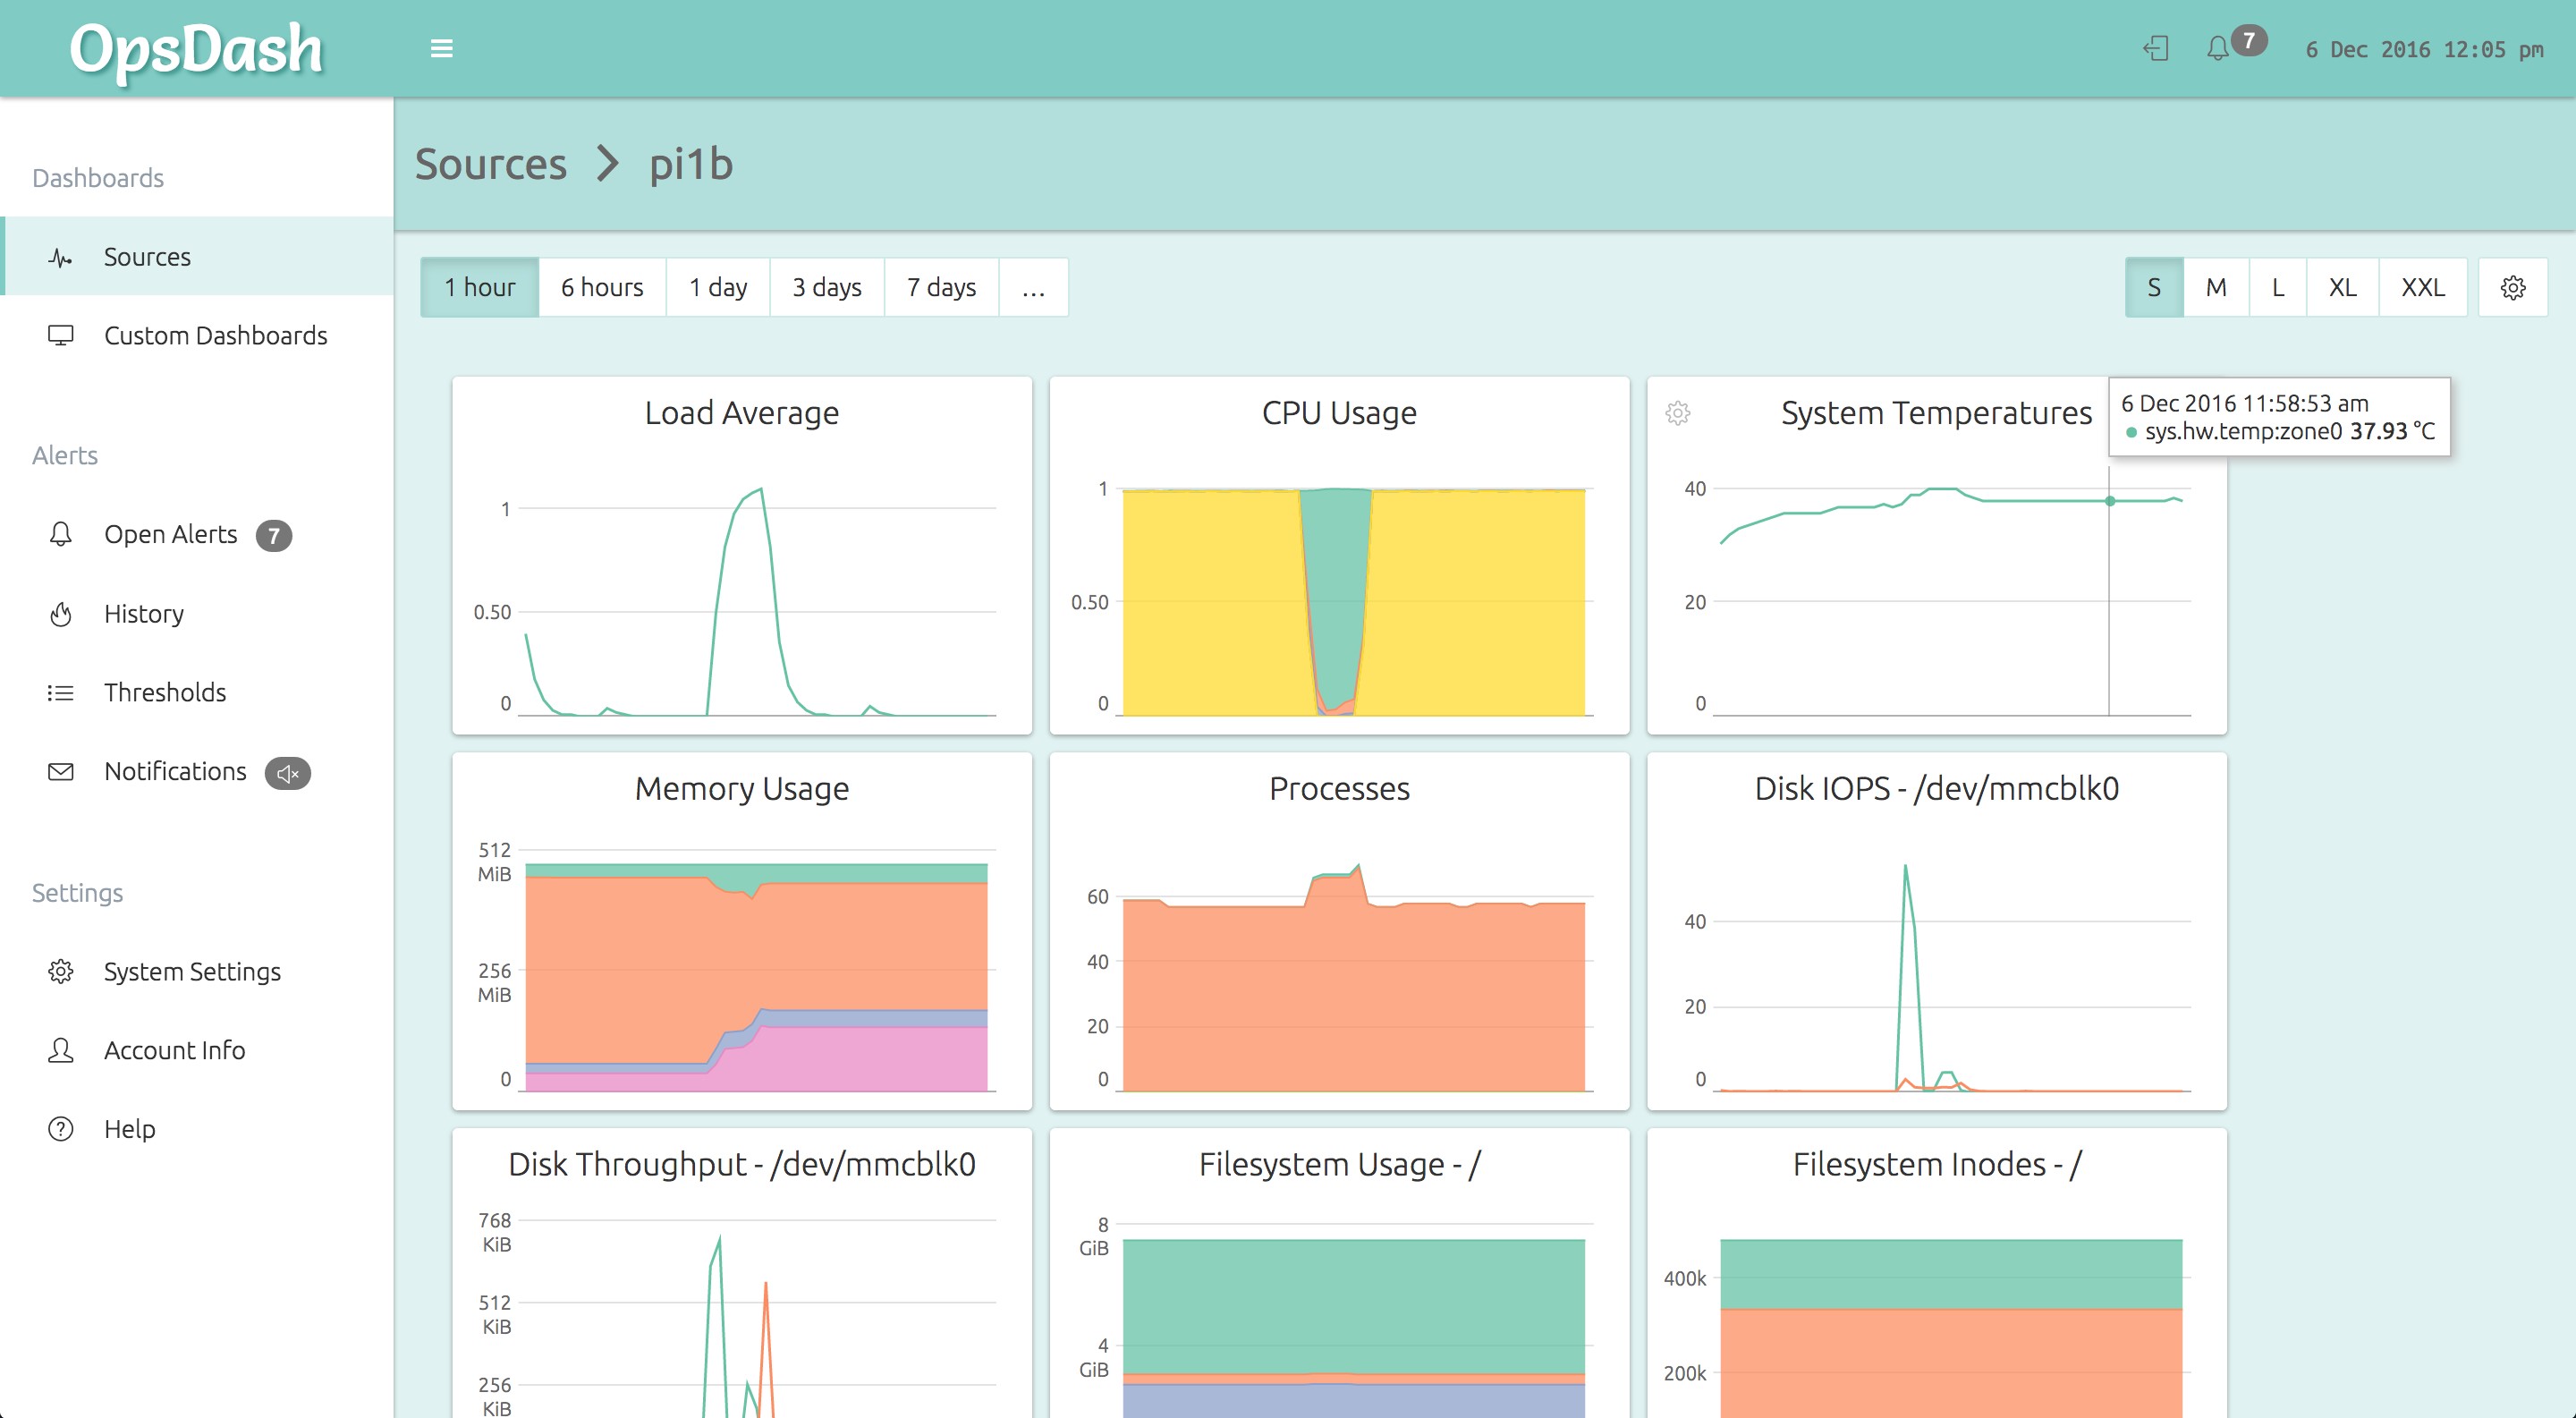
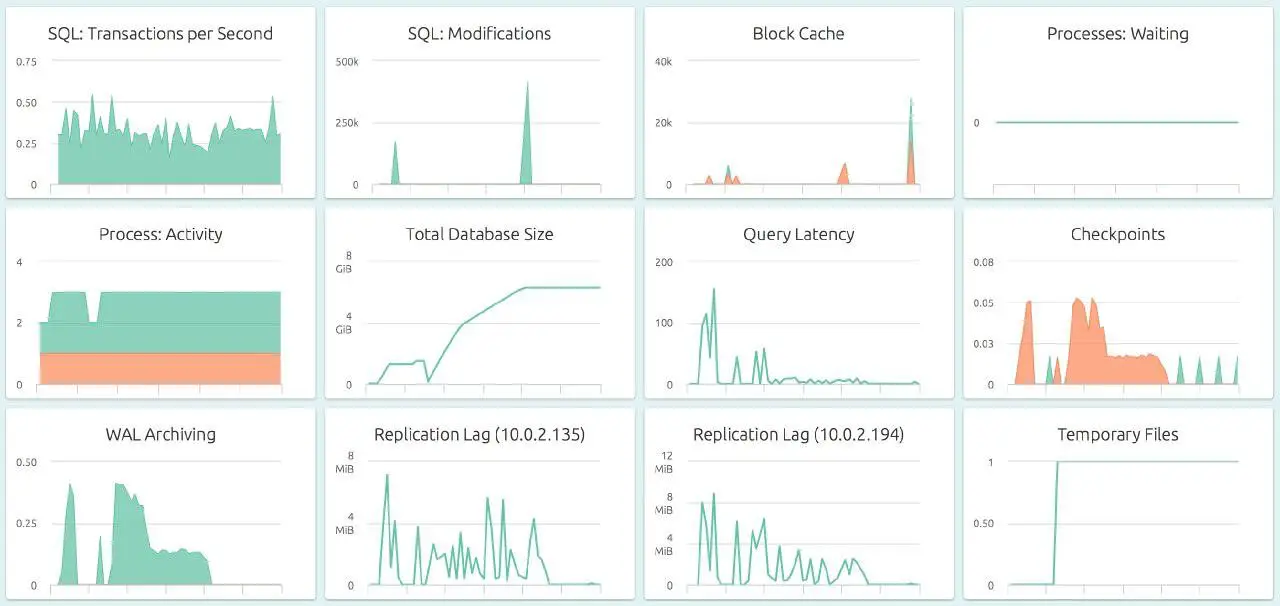
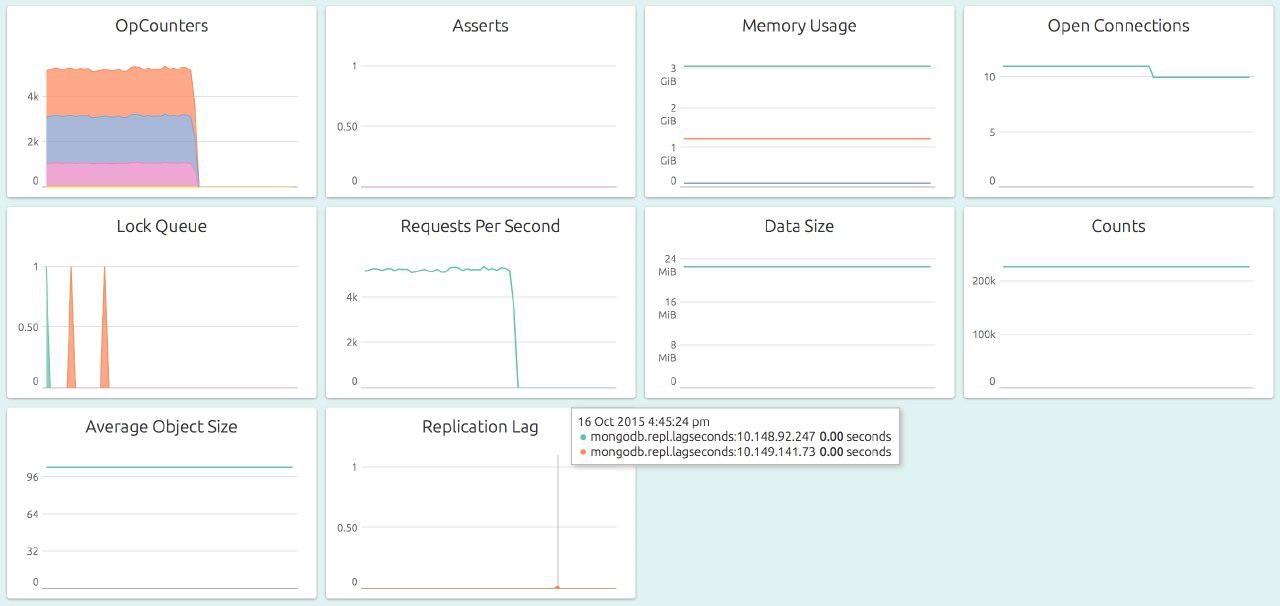
OpsDash는 MySQL, PostgreSQL, MongoDB, Docker, Memcache, Redis, Apache, Nginx, Elasticsearch 등을 모니터링하기위한 서버 모니터링, 서비스 모니터링, 데이터베이스 모니터링, 앱 메트릭 모니터링 및 가동 시간 모니터링 솔루션입니다.이메일, HipChat, Slack, OpsGenie, PagerDuty VictorOps 및 Webhook을 통해 지능적이고 사용자 정의 가능한 대시 보드 및 규칙 기반 경고 및 알림을 제공합니다.각 에이전트에 내장 된 StatsD 및 Graphite 인터페이스를 사용하여 사용자 지정 지표를 보냅니다.
웹 사이트:
https://www.opsdash.com/카테고리
Mac 용 OpsDash의 대안
68
33
22
CloudRadar Monitoring
CloudRadar는 강력하고 간단하며 저렴한 서버 및 네트워크 모니터링 솔루션입니다.서버 CPU, 메모리, 디스크 및 프로세스, 네트워크 장치 및 웹 자산을 모니터링합니다.30 초 안에 모니터링을 시작하십시오.무료 평가판 – 신용 카드가 필요하지 않습니다.
20
8