0
Statpedia
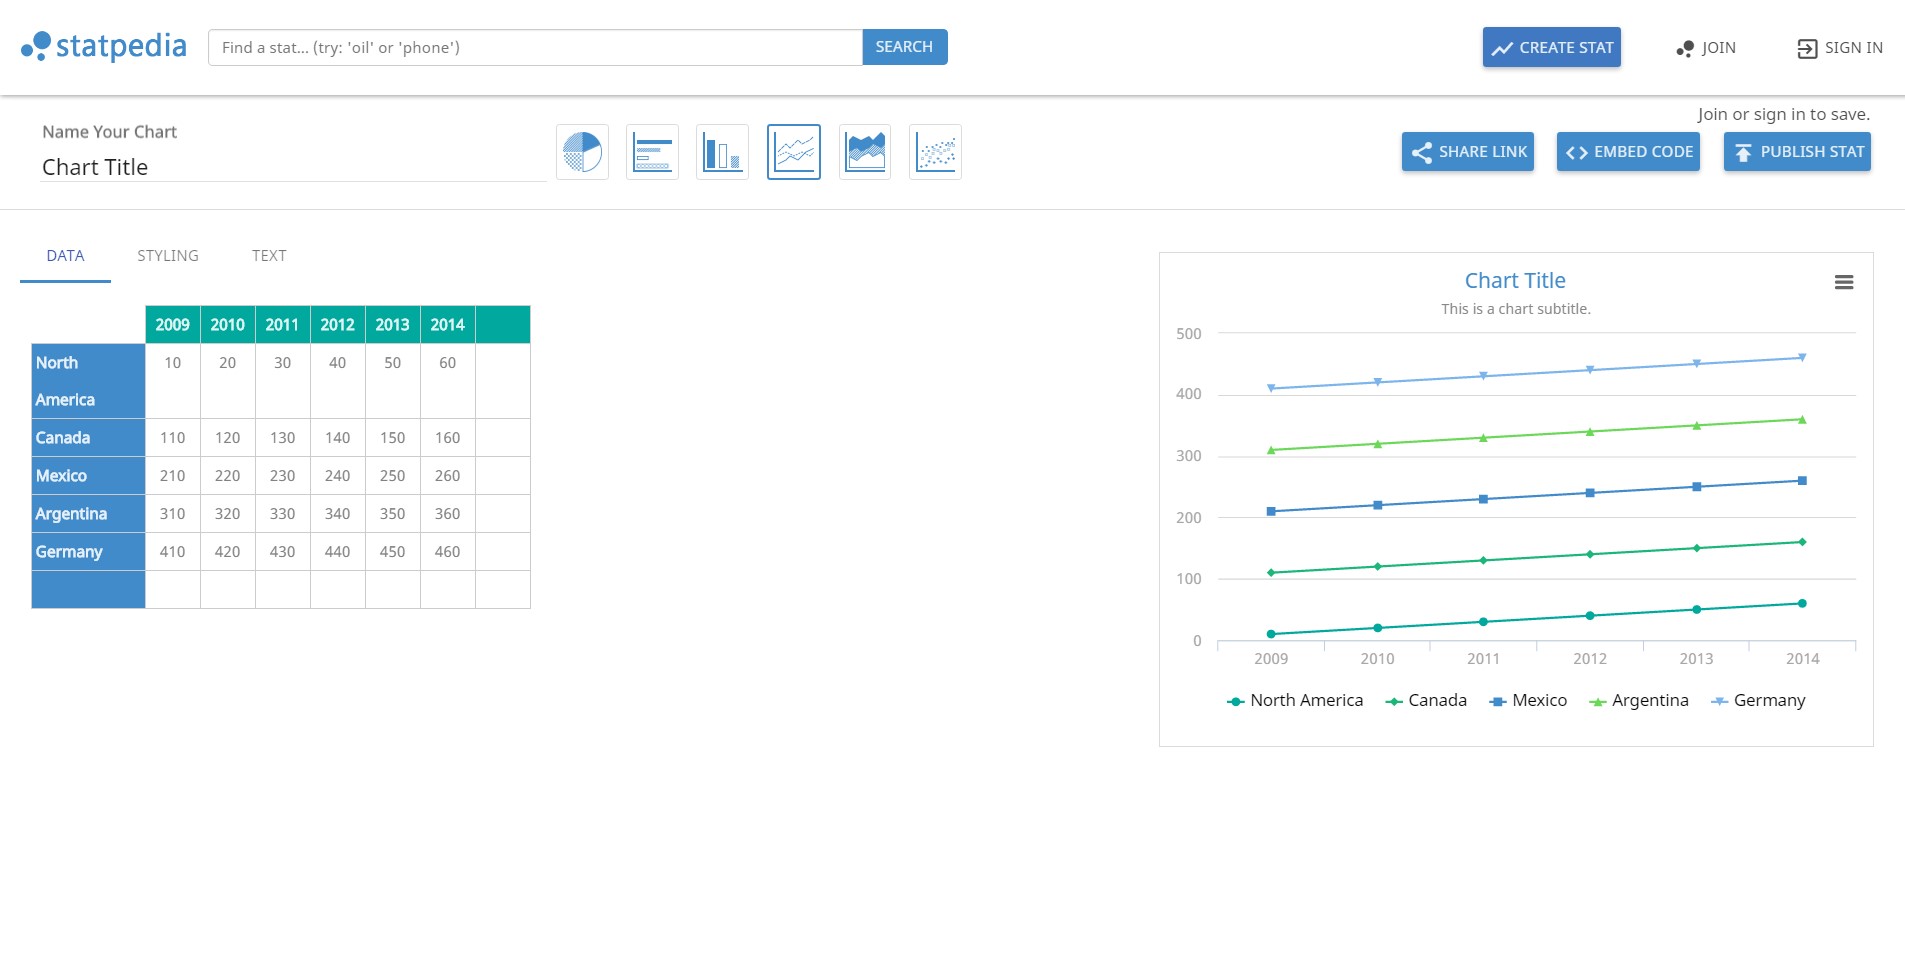
온라인으로 데이터 시각화를하는 것이 결코 쉬운 일이 아닙니다.특징 생성-Statpedia는 통계를 작성하는 것이 가능한 간단합니다.검색-새로운 통계가 항상 생성됩니다.통계를 탐색하려면 검색을 실행하십시오.공유-준비가되면 동료와 공유하고 통계를 게시하십시오.
웹 사이트:
http://statpedia.com카테고리
라이센스가있는 모든 플랫폼에서 Statpedia를 대체
26
22
14
FusionCharts Suite XT
FusionCharts Suite XT를 사용하면 모든 웹, 모바일 및 엔터프라이즈 애플리케이션을위한 대화식 JavaScript 차트, 게이지 및 맵을 간단하게 작성할 수 있습니다.
11
ChartURL
개발자 및 마케팅 담당자가 이메일, 슬랙 봇, 웹 / 모바일 앱 등에 개인화 된 차트를 포함 할 수있는 Google 이미지 차트의 대안.
- 프리미엄 앱
- Web
- Self-Hosted
8
1
KoolChart
Koolcharts는 HTML5를 완벽하게 지원하는 차트 솔루션을 제공합니다.여러 가지 슬라이딩 효과를 사용하여 데이터를 렌더링하므로 원하는 효과를 선택하고 슬라이딩 효과의 시간을 설정할 수 있습니다.
- 유료 앱
- Web
- JavaScript
0